
I should probably start with an apology: this one is going to get technical. Still, I hope you’ll stick with it, because understanding how and why we take such care over measuring the quality of white light is key to understanding the benefits of modern lighting equipment such as that based on fluorescent and LED sources. Even more crucially, it’s also key to understanding the potential problems, and the sort of tactics available to the average snake-oil salesman to cover up those problems.
Most of us know that white light is made up of a mixture of all the colors in the spectrum, or to be a bit more scientific about it, all the visible wavelengths of radiation. Wavelengths of light are short – 550 nanometers is green, 700 red and about 450 a really deep blue. The problem, which is fairly well known, is that almost no lighting equipment emits the same amount of light at every wavelength. Scientifically, they have a non-uniform spectral power distribution. If you are trying to illuminate an object that reflects light at a rather specific wavelength that is absent from the so-called white light you’re shining on it, you may have a problem that’s impossible to predict just by looking at things with your eyes.
Producing a Number
This was a fairly benign problem in the times when the only lights available were tungsten and arc lights, which don’t have complicated spikes and holes in their spectral power distribution. They may have a lot of blue or a lot of red, but the shape of the graph is generally smooth and there are no unpleasant surprises. More modern lighting technologies, such as LED or fluorescent tubes, do have strange features in their spectral power distribution, and these features are often not readily visible to the human eye, especially without test charts specifically designed to expose problems with that particular type of light source, and a better light source (such as daylight) against which to compare it.
A simple numeric value which describes the color quality of an ostensibly white light is therefore an attractive idea. This is intrinsically a difficult thing to do, because a white-looking light source could feasibly have almost any number of complex features in its output, which could affect the rendering of various colors in various ways. Representing such a variable situation as a single number is always going to be imprecise and reliant on assumptions made by the people who designed the assessment system. Most people are familiar with the idea of the Color Rendering Index, or CRI, which tries to score the quality of a white light as a percentage, with daylight at an ideal 100. It’s a simple thing to use, but it isn’t perfect.
Problems with CRI

As with any practical color measurement, CRI in its basic form relies on illuminating a set of known color samples with the light under test and measuring the amount of energy that’s reflected back from each sample. For CRI, the specified samples come from the work of Prof. Albert H. Munsell, a color scientist who, in the 1900s, was the first to produce a mathematical model in which equal changes to the numbers produce equal changes in the way the color looks to humans. It’s important that color samples reflect color with the right spectrum; it’s possible to have two apparently identical colors, which reflect quite differently, as the human eye only evaluates color using three types of light-sensitive cells.
The problem with CRI is that only 14 samples are used, and the first eight are pretty low saturation. Low saturation simply means that they reflect a broad range of frequencies, which means we can’t really tell much about what might be quite narrow, yet quite large, spikes in the spectrum of the light source we’re evaluating. The remaining six samples comprise a shade similar to foliage and one similar to Caucasian skin, plus four highly saturated primaries. These are useful, but as there are only four of them, big irregularities could sneak through the gaps in between. There are other problems, particularly with the way the results from each test sample are averaged.
Practical CRI evaluations these days are done mathematically by performing a full spectrum analysis on the light source, but the results, and thus the problems, are the same. The result is that lights with a high CRI number – above 90 – may still cause problems for directors of photography, especially when that carefully-chosen fabric comes out the wrong color.
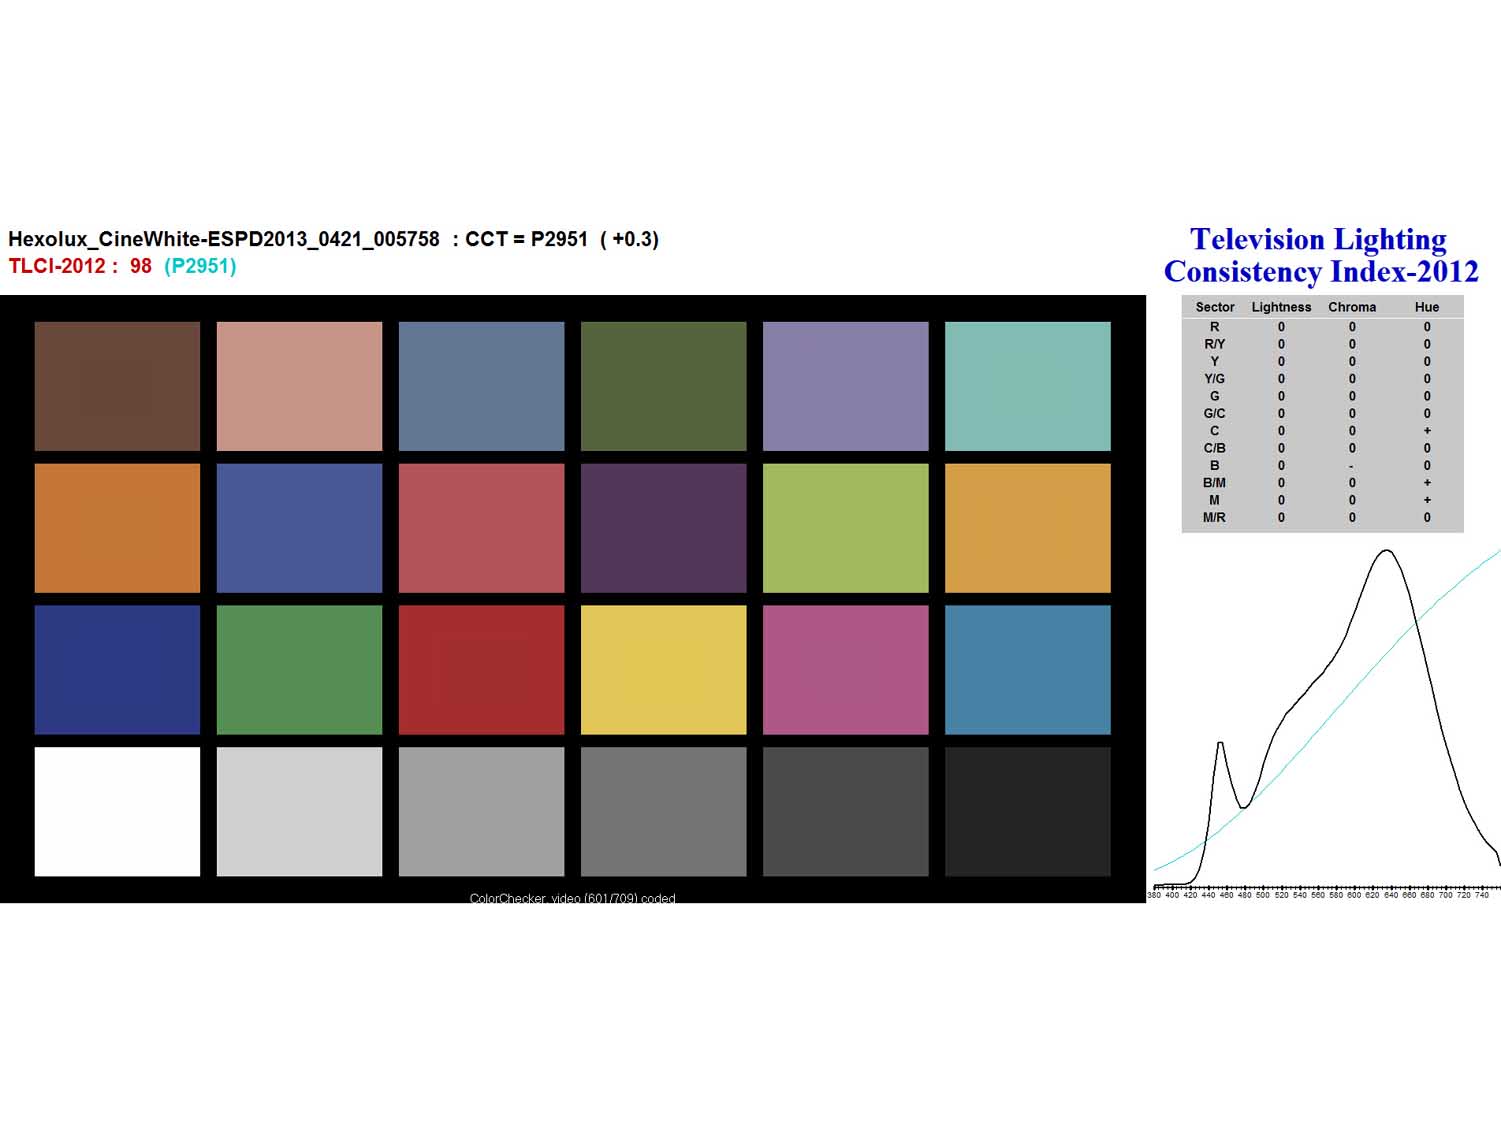
The Television Lighting Consistency Index (TLCI)
There have been attempts to solve this problem before, particularly by the CIE‘s Technical Committee 1-33 which developed modifications to CRI known as R96a, specifying a more complete set of color samples and better mathematics. This failed to gain wide acceptance, the committee breaking up in 1999 without agreement, at least partially due to objections from the lamp manufacturing industry, which brings us back to the snake-oil salesmen.
The Television Lighting Consistency Index, in its 2012 guise, is an effort by the EBU to standardize something that’s better even than R96a, inasmuch as it models the sort of processes that go on inside a television camera and monitor chain, whereas CRI was never intended to be used in television production. It uses a wide-ranging and well-known set of test samples, widely known as a Macbeth chart (properly, X-Rite‘s ColorChecker chart). The mathematics are improved so that large isolated errors aren’t averaged-out, and TLCI numbers acceptable for film and TV work aren’t concentrated solely in the upper 10 percent of values (values above 50 should be correctable).
The complete specification for TLCI-2012 is given in EBU Tech 3355, although EBU R-137 is a more readable overview for most purposes.
Real World Implications
I asked eight companies selling LED lighting at NAB for TLCI data for their products. Of the eight, only one had heard of TLCI, although I notice that Hexolux has (very good) TLCI data on its website.
What’s worrying is that many LED lights, particularly the low-cost types reliant solely on a single type of simple LED driver, already have fairly poor CRI numbers in the 70s, and would presumably do even less well on the more stringent TLCI. I hope that more companies will begin to use TLCI and provide the appropriate results, both so we can understand the performance of existing equipment, and with any luck, to motivate better engineering, and ultimately lights we can use without having to worry too much about how white it really is.


